Data Analytics and Business Intelligence 2025: Turning Data into Decisions

Business intelligence (BI) turns raw operational data into actionable dashboards and reports using tools like Tableau, Power BI, or Looker. Data analytics goes further - applying statistical modeling and machine learning to predict future outcomes. In 2025, the fastest path to BI value is a modern data stack: dbt for data transformation, a cloud data warehouse (Snowflake, BigQuery, or Redshift), and a visualization layer connected to your key business metrics.
Commercial Expertise
Need help with AI & Machine Learning?
Ortem deploys dedicated AI & ML Engineering squads in 72 hours.
Next Best Reads
Continue your research on AI & Machine Learning
These links are chosen to move readers from general education into service understanding, proof, and buying-context pages.
AI & ML Solutions
Move from concept articles to real implementation planning for copilots, RAG, automation, and analytics.
Explore AI servicesAI Agent Development
See how Ortem builds autonomous workflows, tool-using agents, and human-in-the-loop systems.
View agent serviceAI Product Case Study
Study a production AI platform with architecture, launch scope, and operating model context.
Read case studyData analytics and business intelligence have moved from competitive advantage to operational necessity. In 2025, companies that cannot answer basic questions about their customers, their revenue, and their operations from data — in real time, without a two-week IT request — are at a structural disadvantage against competitors who can. The global business intelligence market reached $33.3 billion in 2024, growing at 14% annually, driven by the shift from IT-gated reporting to self-service analytics accessible to every business user.
The Four Stages of Analytics Maturity
Stage 1 — Descriptive (what happened?): Historical data aggregated into dashboards and reports. Revenue by month. Orders by product. Support tickets by category. The data is accurate and structured but arrives days or weeks after the events it describes. Decisions are made on last week's reality, not today's.
Stage 2 — Diagnostic (why did it happen?): The ability to drill down into descriptive data to identify root causes. Revenue dropped 15% in March — which product categories drove it? Which customer segments? Which acquisition channels? Diagnostic analytics requires flexible data exploration tools and clean, well-modeled data. Most modern BI platforms (Tableau, Power BI, Looker) support this when the underlying data model is built correctly.
Stage 3 — Predictive (what will happen?): Machine learning models trained on historical data that forecast future outcomes. Churn prediction models identify customers likely to cancel in the next 30 days. Demand forecasting models optimize inventory before stockouts occur. Lifetime value models prioritize acquisition spend on the customer cohorts that generate the highest long-term revenue.
Stage 4 — Prescriptive (what should we do?): Systems that not only predict outcomes but recommend or automatically execute optimal actions. Pricing engines that update product prices in real time based on demand signals. Marketing attribution systems that automatically reallocate spend to highest-performing channels. This is where analytics becomes autonomous and generates ROI without requiring analyst time.
The Modern Data Stack
The technology landscape for data analytics has changed dramatically in the last five years. The monolithic on-premises data warehouse that required months to implement has been replaced by cloud-native components that can be assembled in weeks and maintained by a team of 2-5 engineers.
The ingestion layer moves data from operational systems — CRM, ERP, e-commerce platform, payment processor, marketing tools — into your data warehouse. Modern ELT tools (Fivetran, Airbyte, Stitch) provide pre-built connectors to 200+ data sources. They extract data on a schedule, load it into your warehouse, and let you transform it there. This ELT pattern versus the traditional ETL pattern is the most important architectural shift in data engineering of the last decade — it preserves raw data for reprocessing and decouples ingestion from transformation.
The storage layer: Snowflake separates compute from storage, scales elastically, handles structured and semi-structured data natively, and has excellent multi-cloud support — strong choice for platform-agnostic organizations. Google BigQuery is the default for Google Cloud ecosystem organizations — serverless architecture means no infrastructure management. Amazon Redshift is the natural choice for AWS-heavy organizations with tight integration with other AWS services.
dbt (data build tool) has become the standard for the transformation layer — taking raw ingested data and transforming it into clean, reliable, business-logic-encoded models that BI tools and analysts query. dbt models are SQL files with version control, testing, and documentation built in. They create a single source of truth for business metrics: "revenue" is defined once in a dbt model, and every downstream report uses that definition.
The visualization layer: Tableau remains the most powerful visualization platform for analysts who need to explore data flexibly — higher cost at $75/user/month but strongest capabilities. Power BI is the default for Microsoft ecosystem organizations at $10/user/month. Looker (Google) is built on a semantic model layer (LookML) that ensures business metrics are defined consistently across all reports. Metabase is the open-source alternative for startups — free self-hosted tier, easy to use for non-technical business users.
Building Your Analytics Infrastructure: Practical Steps
Step 1 — Inventory your data sources: Understand what data you have, where it lives, and what business questions it can answer. Common sources: CRM, e-commerce platform, payment processor, product analytics (Mixpanel, Amplitude), marketing platforms (Google Ads, Meta), and customer support tools.
Step 2 — Define your key metrics before building dashboards: The most common analytics failure is building dashboards first and discovering the underlying data model does not support the metrics you actually need. Define your 10–15 critical business metrics (North Star metric, primary input metrics, and guardrail metrics) before building anything. Document: the exact calculation for each metric, which data source it comes from, how it handles edge cases (partial periods, refunds, multi-currency), and who is the business owner responsible for its accuracy.
Step 3 — Build the data model in dbt: dbt transforms raw data from your warehouse into clean, tested, business-logic-encoded models. The standard dbt layer structure: staging models (clean and type-cast raw data), intermediate models (join and reshape data across sources), and mart models (final tables optimized for BI consumption). Business logic lives in dbt, not in BI tools — this ensures every report using "revenue" uses the same definition.
Step 4 — Start with one high-value use case: Build the dashboard that answers the question most frequently asked by your CEO or leadership team first. Not the most technically interesting dashboard — the one that will be used every day. Demonstrated value of the first use case generates organizational support for the broader analytics investment.
Step 5 — Instrument product analytics separately: Product analytics (what are users doing in your product?) and business analytics (what is the business doing?) require different tools and approaches. Amplitude or Mixpanel for product analytics, your data warehouse for business analytics. They should be connected — product event data should eventually land in your warehouse for combined analysis.
Real-Time Analytics: When You Need It and When You Don't
Most analytics use cases do not require real-time data. Revenue dashboards updated every hour are sufficient for most business decisions. A daily refresh of customer cohort analysis is appropriate. Running incremental dbt models hourly provides near-real-time business metrics without the infrastructure complexity of true streaming.
True real-time analytics (sub-second latency) is required for:
- Operational fraud detection (payment fraud decisions must be made in <200ms)
- Live customer-facing dashboards (a customer viewing their own analytics in your SaaS product expects current data)
- Trading and financial systems where stale data has direct financial consequences
- IoT monitoring where operational decisions depend on current sensor readings
Real-time analytics infrastructure requires: Kafka or AWS Kinesis for event streaming, Apache Flink or Spark Streaming for stream processing, a purpose-built real-time analytics database (ClickHouse, Apache Pinot, or Druid — these handle high-write-throughput and fast analytical queries in ways that Snowflake and BigQuery cannot). The cost premium for real-time is significant — 2–5x higher infrastructure and engineering investment than batch analytics for equivalent coverage.
Common Analytics Failures and How to Avoid Them
Building before defining: The most expensive mistake is building a data warehouse and dashboards before defining the business questions they must answer. The result is a sophisticated data infrastructure that no one uses because it does not answer what stakeholders actually need.
Inconsistent metric definitions: "Revenue" means different things to different teams. Sales says bookings. Finance says recognized revenue. Product says MRR from active subscriptions. Without a single documented source of truth in dbt, every team produces different numbers and spends meeting time arguing about whose numbers are right rather than making decisions.
Dashboard proliferation without governance: Without a governance process, analytics environments accumulate hundreds of dashboards — most outdated, many contradictory. Quarterly dashboard audits (deleting dashboards with no views in 90 days, reviewing ownership of remaining dashboards) maintain the quality and trustworthiness of your analytics environment.
Neglecting data quality: A data pipeline that runs but produces incorrect numbers is worse than no pipeline — it generates confident wrong decisions. Invest in dbt tests (not null, unique, referential integrity, custom business logic checks) from the beginning. Every model should have tests that catch data quality issues before they reach dashboards.
Poor documentation: Data models without documentation require every new analyst to reverse-engineer existing logic. dbt's built-in documentation (dbt docs generate) creates a browsable data dictionary automatically from your model descriptions. Maintaining this documentation should be a sprint requirement, not an optional extra.
Analytics Team Structures
Centralized analytics team: A dedicated team of data engineers and analysts serves the entire organization. Provides consistency and quality control. Risk: becomes a bottleneck when every team's analytics requests queue behind other priorities.
Embedded analytics: Analytics practitioners sit within business units (marketing analyst, product analyst, finance analyst). Close to the business problem; risk of inconsistent data practices and duplicated work across teams.
Hub and spoke (recommended for growth-stage companies): A small central platform team owns the data infrastructure, data models, and governance standards. Embedded analysts in business units build on top of the central platform rather than building their own data pipelines. This balances consistency with proximity to business problems.
Frequently Asked Questions
Q: How much does a modern data analytics stack cost? For a 50-person company with moderate data volumes: Fivetran ($500–$2,000/month for connectors), Snowflake ($500–$2,000/month), dbt Cloud ($100–$500/month), Tableau or Looker ($1,000–$5,000/month). Total: $2,100–$9,500/month in tooling, plus 1–2 full-time data engineers at $150,000–$200,000/year each. For startups, the open-source stack (Airbyte, DuckDB or BigQuery free tier, dbt core, Metabase) reduces tooling cost to near zero.
Q: Should we hire a data engineer or a data scientist first? For most companies at the analytics-maturity Stage 1–2, hire a data engineer first. You need reliable data pipelines and clean data models before analytics can deliver value. Data science (predictive models, ML) builds on a foundation of reliable data infrastructure. Hiring a data scientist before having clean data results in expensive analysts spending 80% of their time on data cleaning rather than modeling.
Q: How long does it take to see ROI from a data analytics investment? First reliable dashboard: 4–8 weeks. First data-driven decision made using the platform: 8–16 weeks. Demonstrable business impact from analytics-informed decisions: 6–18 months. Analytics ROI is indirect — it comes from better decisions, not from the platform itself. Establish a baseline for key decisions before implementing analytics (how often does the team change pricing? what conversion rate does the current funnel achieve?) and measure change after analytics adoption.
AI-Augmented Analytics: The Next Layer
The latest shift in business intelligence is AI-augmented analytics — natural language querying, automated insight generation, and anomaly detection that identifies important changes without requiring analysts to build specific reports.
Natural language querying (NLQ): Tools like ThoughtSpot, Google Looker's conversational analytics, and Tableau Pulse allow business users to ask questions in plain English ("What drove the decline in conversion rate last week?") and receive structured chart responses. NLQ is most valuable for infrequent, exploratory questions that do not justify building a dedicated dashboard.
Automated anomaly detection: ML-based anomaly detection monitors all your key metrics continuously and surfaces significant deviations before a human analyst would notice them in static dashboards. Datadog Watchdog for infrastructure, Sifflet or Monte Carlo for data quality anomalies, and custom ML models for business metric anomalies.
LLM-generated insight summaries: Weekly automated summaries of key metric changes, their likely causes (based on correlated metric movements), and recommended actions — generated by an LLM with access to your data — are increasingly available in modern BI platforms and custom implementations.
Build your data analytics platform → | Custom software development → | AI & ML solutions →
About Ortem Technologies
Ortem Technologies is a premier custom software, mobile app, and AI development company. We serve enterprise and startup clients across the USA, UK, Australia, Canada, and the Middle East. Our cross-industry expertise spans fintech, healthcare, and logistics, enabling us to deliver scalable, secure, and innovative digital solutions worldwide.
Get the Ortem Tech Digest
Monthly insights on AI, mobile, and software strategy - straight to your inbox. No spam, ever.
About the Author
Editorial Team, Ortem Technologies
The Ortem Technologies editorial team brings together expertise from across our engineering, product, and strategy divisions to produce in-depth guides, comparisons, and best-practice articles for technology leaders and decision-makers.
Stay Ahead
Get engineering insights in your inbox
Practical guides on software development, AI, and cloud. No fluff — published when it's worth your time.
Ready to Start Your Project?
Let Ortem Technologies help you build innovative software solutions for your business.
You Might Also Like
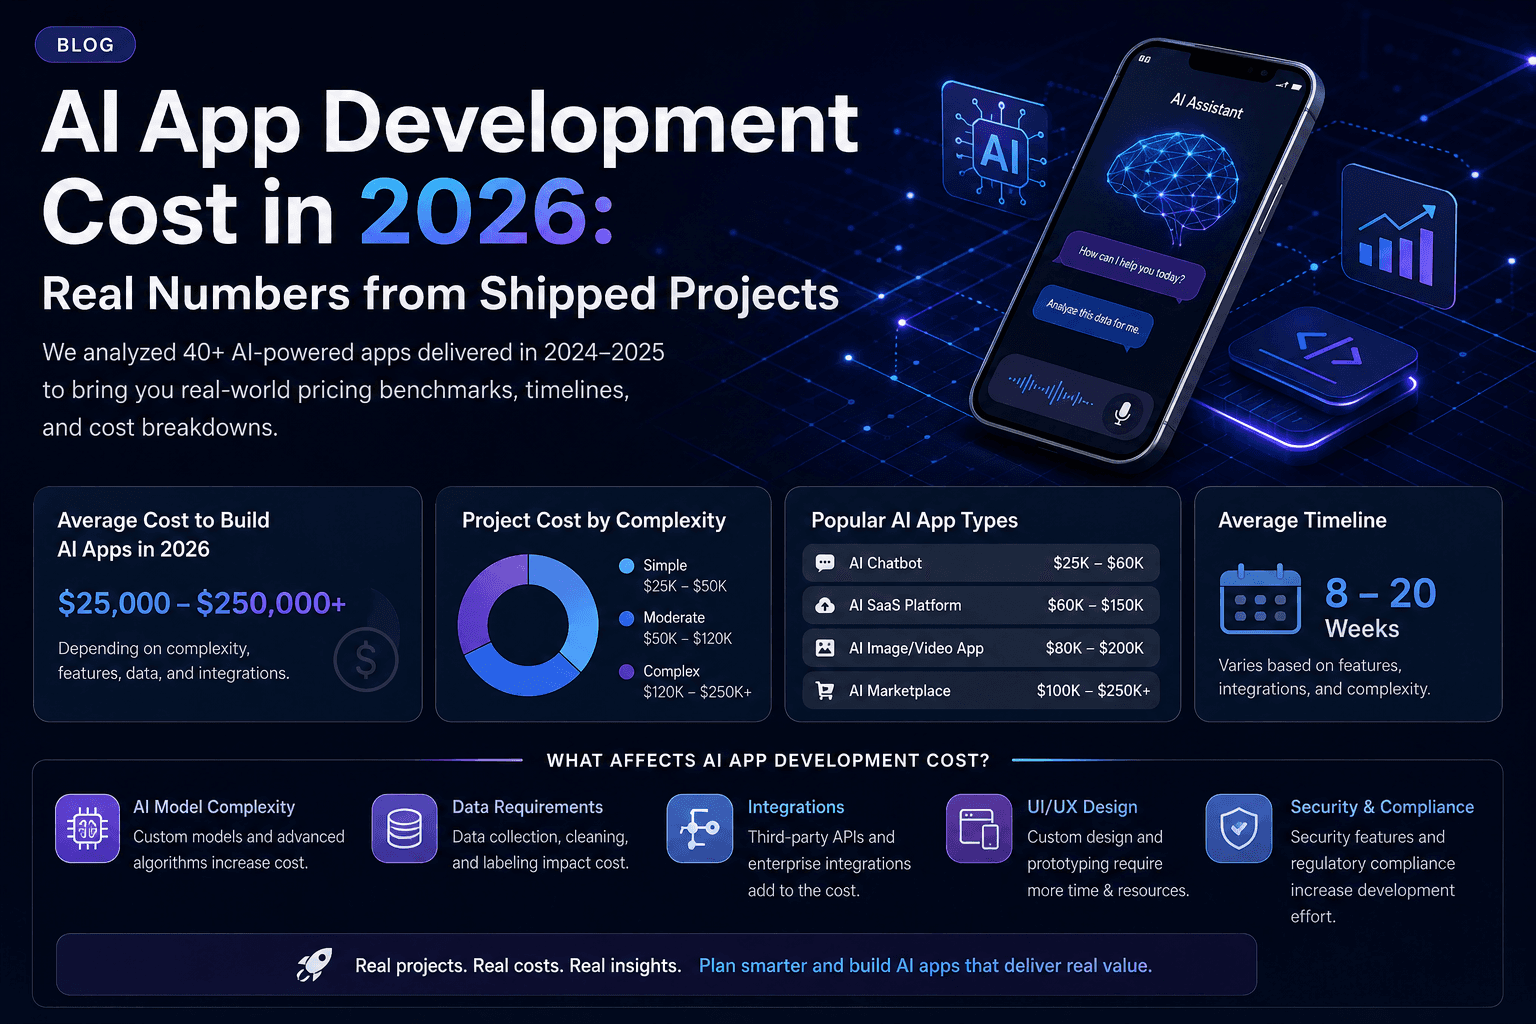
AI App Development Cost in 2026: Real Numbers from Shipped Projects
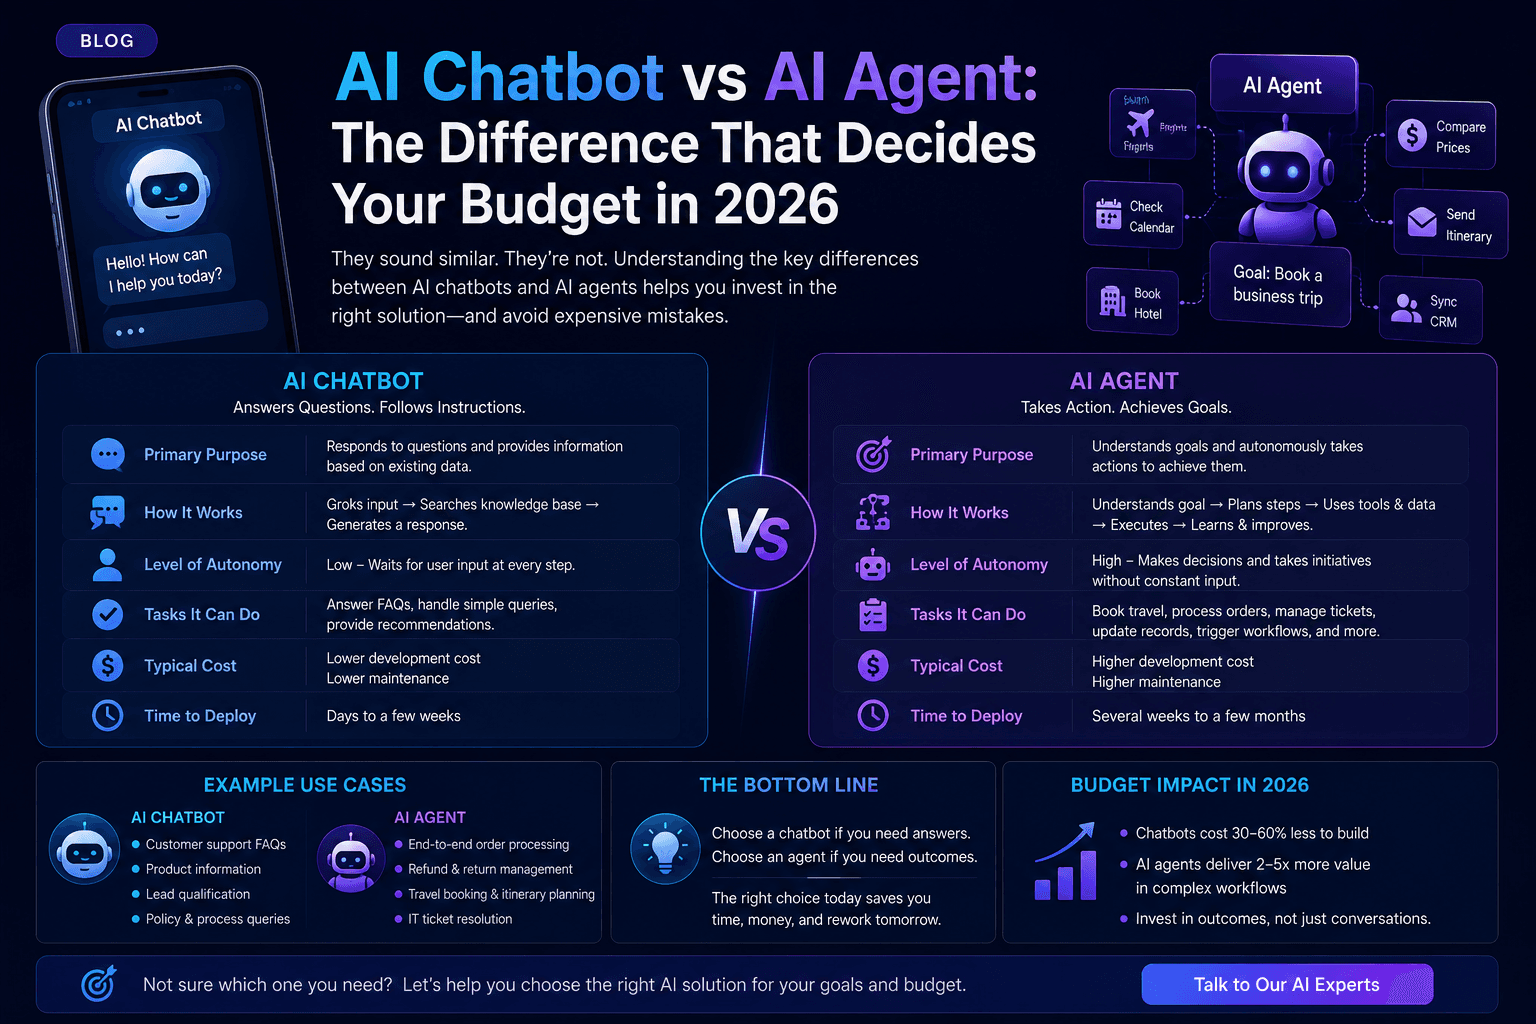
AI Chatbot vs AI Agent: The Difference That Decides Your Budget in 2026