15 Fleet Management KPIs With Formulas: Utilization, Cost per Mile, Uptime and More
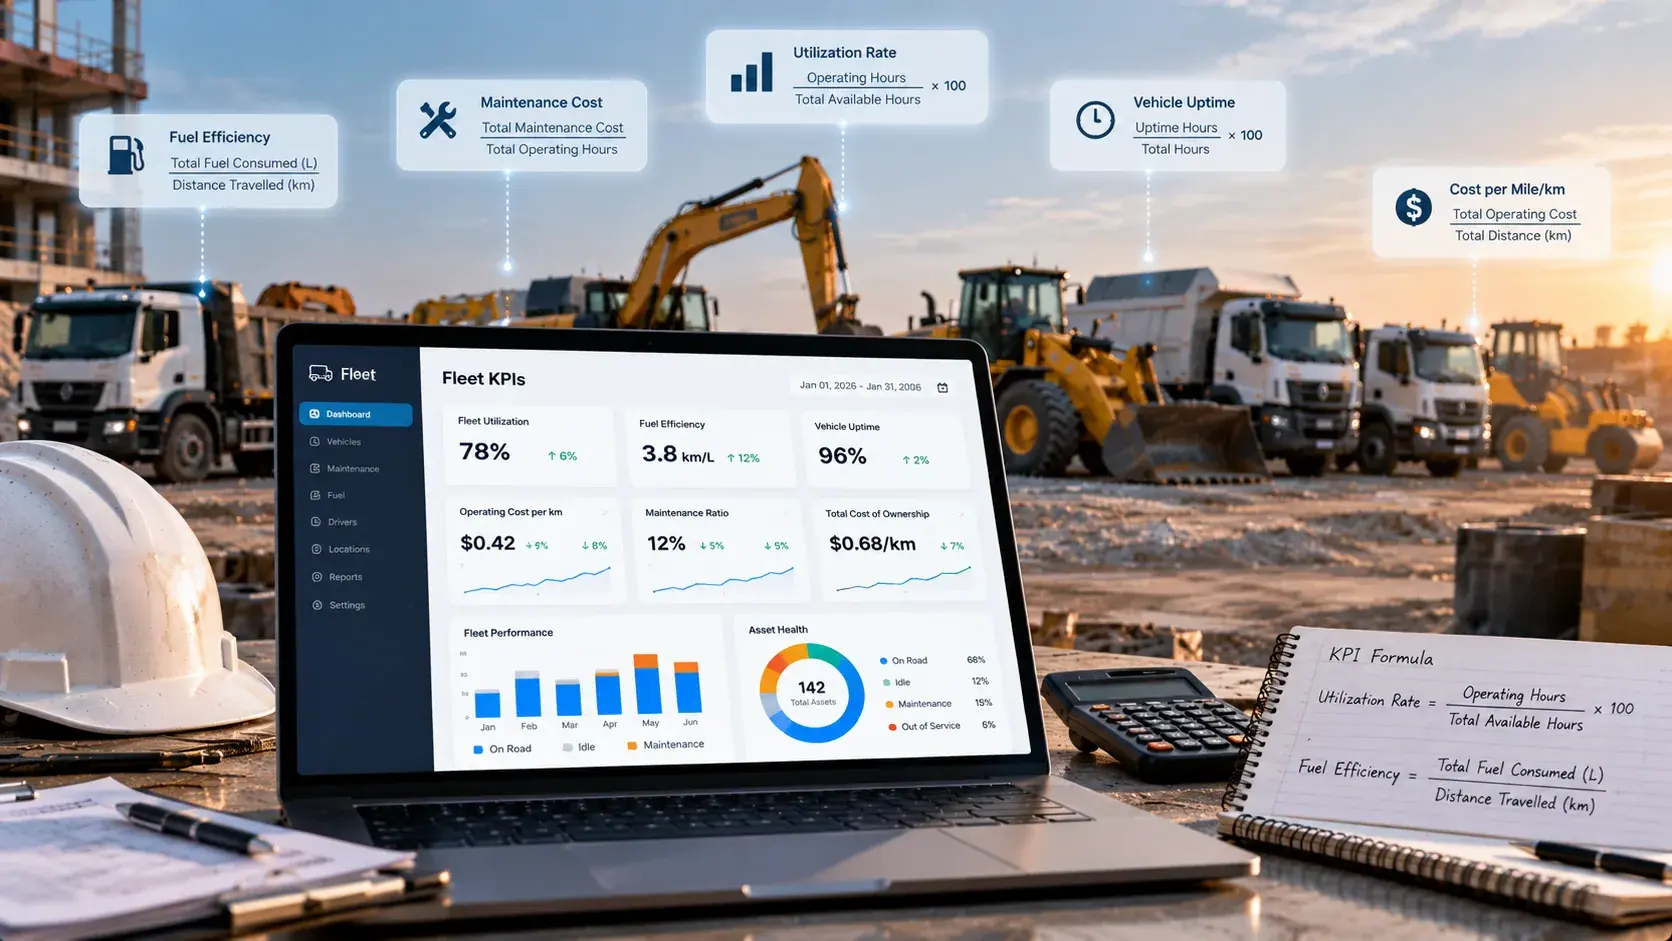
The most important fleet management KPIs are utilization rate, cost per mile or per engine hour, vehicle uptime, preventive maintenance compliance, unplanned maintenance ratio, mean time between failures, mean time to repair, fuel economy, idle time and accident rate. Each needs one agreed formula and one data source. Fleet utilization rate, for example, is hours used divided by hours available, multiplied by 100.
Next Best Reads
Continue your research on Industry Solutions
These links are chosen to move readers from general education into service understanding, proof, and buying-context pages.
Industries Ortem Serves
See vertical-specific delivery experience across healthcare, fintech, logistics, and retail.
View industriesCustom Software Development
Move from industry research into scoping for dashboards, workflows, and internal systems.
Explore software serviceIndustry Platform Case Study
Review how Ortem shipped a multi-tenant production platform with real operational requirements.
Read case studyFleet management KPIs are the numbers that tell you whether your vehicles and equipment are used well, maintained well and run at a sensible cost. The hard part is not choosing KPIs. It is making sure everyone calculates them the same way.
This guide defines 15 KPIs. For each one you get the formula, the data you need, and how to read the result. At the end, we show how to turn them into a dashboard.
How to Use This List
Three rules make fleet KPIs useful:
- One formula per KPI, written down. "Utilization" means nothing until you define available time.
- Automatic inputs. Pull hours, miles and fuel from telematics, and costs from maintenance and accounting records. Hand-typed numbers drift.
- Compare like with like. Compare an asset with its own history and with similar assets before you compare it with industry averages.
Utilization KPIs
1. Fleet utilization rate
Formula: Utilization rate (%) = Hours in use ÷ Hours available × 100
Data: Engine hours or trip time from telematics. Available hours from your working calendar.
Utilization is the KPI most fleets get wrong, because "available" is vague. Pick one definition, such as scheduled shift hours excluding planned maintenance, and apply it to every asset.
For road vehicles you can measure utilization in days used or miles driven instead of hours. For heavy equipment, use engine hours.
How to read it: Low utilization across a group of similar assets suggests you own too many. High utilization on a few assets suggests uneven allocation, and those assets will wear out first.
2. Idle time percentage
Formula: Idle time (%) = Idle hours ÷ Engine hours × 100
Data: Idle hours and engine hours from telematics. Heavy equipment reports both through the ISO 15143-3 standard.
Idling burns fuel and adds engine hours without doing work. That means earlier services and lower resale value.
3. Asset availability (uptime)
Formula: Availability (%) = (Scheduled hours − Downtime hours) ÷ Scheduled hours × 100
Data: Downtime from work orders, scheduled hours from your operating calendar.
Availability tells you whether assets are ready when you need them. Track planned and unplanned downtime separately.
Cost KPIs
4. Cost per mile or per engine hour
Formula: Cost per mile = Total operating cost ÷ Miles driven For equipment: Cost per engine hour = Total operating cost ÷ Engine hours
Data: Fuel, maintenance, repairs, tyres, insurance and depreciation or lease costs from accounting and maintenance records. Miles or hours from telematics.
Decide whether to include driver wages, and say so on the report. The American Transportation Research Institute publishes an annual analysis of trucking operating costs, which is a useful reference point for US truck fleets.
5. Fuel cost per mile
Formula: Fuel cost per mile = Fuel spend ÷ Miles driven
Data: Fuel card transactions and telematics mileage.
This separates fuel from other costs, so you can see the effect of routes, idling and driver behaviour.
6. Fuel economy
Formula: Miles per gallon = Miles driven ÷ Gallons used For equipment: Fuel per engine hour = Fuel used ÷ Engine hours
Data: Telematics fuel data or fuel card transactions matched to vehicles.
Compare each asset against others of the same model and duty. A sudden drop can point to a mechanical problem.
7. Maintenance cost per asset
Formula: Maintenance cost per asset = Parts + labour + outside repair costs for the asset ÷ period
Data: Work orders and invoices.
Rising maintenance cost is often the earliest signal that an asset is approaching replacement.
8. Total cost of ownership
Formula: TCO = Purchase or lease cost + Operating costs + Maintenance costs − Resale value
Data: Finance records over the asset's life.
TCO drives replacement decisions. Compare it per mile or per engine hour across asset types.
Maintenance KPIs
9. Preventive maintenance compliance
Formula: PM compliance (%) = Preventive services completed on time ÷ Preventive services due × 100
Data: Maintenance schedule and work order completion dates.
This is the single best leading indicator of fleet health. Many fleets target above 90%. US motor carriers must also systematically inspect, repair and maintain their vehicles under federal rules.
10. Planned vs unplanned maintenance ratio
Formula: Planned ratio (%) = Planned maintenance hours ÷ Total maintenance hours × 100
Data: Work orders tagged as planned or unplanned.
Unplanned work costs more and causes downtime. A rising unplanned share means your preventive programme is not working.
11. Mean time between failures (MTBF)
Formula: MTBF = Total operating hours ÷ Number of failures
Data: Engine hours from telematics and breakdown work orders.
Higher is better. Track MTBF by model to spot unreliable equipment types.
12. Mean time to repair (MTTR)
Formula: MTTR = Total repair time ÷ Number of repairs
Data: Work order open and close times.
Lower is better. A high MTTR often points to parts availability or technician capacity, not the asset itself.
13. Inspection defect closure time
Formula: Average closure time = Sum of (defect closed time − defect reported time) ÷ Number of defects
Data: Digital inspection reports and linked work orders.
Driver vehicle inspection reports are a federal requirement for many US commercial vehicles. Fast closure of reported defects is both a safety and a compliance measure.
Safety KPIs
14. Accident rate
Formula: Accident rate = Number of accidents ÷ Miles driven × 1,000,000
Data: Incident reports and telematics mileage.
Expressing accidents per million miles lets you compare fleets and periods of different sizes.
15. Harsh event rate
Formula: Harsh events per 1,000 miles = Harsh braking, acceleration and cornering events ÷ Miles driven × 1,000
Data: Telematics event data.
This is a leading indicator for accidents, fuel waste and wear on brakes and tyres.
Fleet KPI Summary Table
| KPI | Formula | Main data source |
|---|---|---|
| Utilization rate | Hours used ÷ hours available × 100 | Telematics |
| Idle time | Idle hours ÷ engine hours × 100 | Telematics |
| Availability | (Scheduled − downtime) ÷ scheduled × 100 | Work orders |
| Cost per mile or hour | Operating cost ÷ miles or hours | Accounting + telematics |
| Fuel cost per mile | Fuel spend ÷ miles | Fuel cards + telematics |
| Fuel economy | Miles ÷ gallons | Telematics or fuel cards |
| Maintenance cost per asset | Parts + labour + outside repairs | Work orders |
| Total cost of ownership | Purchase + operating + maintenance − resale | Finance |
| PM compliance | On-time PMs ÷ PMs due × 100 | Maintenance schedule |
| Planned ratio | Planned hours ÷ total maintenance hours × 100 | Work orders |
| MTBF | Operating hours ÷ failures | Telematics + work orders |
| MTTR | Repair time ÷ repairs | Work orders |
| Defect closure time | Average of closed − reported time | Inspections |
| Accident rate | Accidents ÷ miles × 1,000,000 | Incidents + telematics |
| Harsh event rate | Events ÷ miles × 1,000 | Telematics |
Building a Fleet KPI Dashboard
A dashboard should answer three questions at a glance: are assets working, are they healthy, and what do they cost?
- Top row: utilization, availability and cost per mile or hour, each with a trend line.
- Second row: PM compliance, open work orders and overdue inspections.
- Drill-down: every number should click through to the assets behind it.
- Alerts: notify people when a KPI crosses a threshold, rather than waiting for the monthly report.
The main technical work is joining data. Telematics, maintenance, fuel cards and accounting usually live in different systems. A shared asset ID, such as VIN or PIN, is what makes the joins reliable.
Where Ortem Can Help
Ortem builds fleet platforms and data layers that calculate these KPIs automatically from telematics, maintenance and finance data. See our fleet management software development services and our Fleet Sync Pro product. For construction fleets, read our guide to construction fleet management software.
About Ortem Technologies
Ortem Technologies is a premier custom software, mobile app, and AI development company. We serve enterprise and startup clients across the USA, UK, Australia, Canada, and the Middle East. Our cross-industry expertise spans fintech, healthcare, and logistics, enabling us to deliver scalable, secure, and innovative digital solutions worldwide.
Get the Ortem Tech Digest
Monthly insights on AI, mobile, and software strategy - straight to your inbox. No spam, ever.
Sources & References
- 1.An Analysis of the Operational Costs of Trucking: 2025 Update - American Transportation Research Institute (ATRI)
- 2.49 CFR 396.3 Inspection, repair, and maintenance - eCFR
- 3.49 CFR 396.11 Driver vehicle inspection report(s) - eCFR
- 4.ISO 15143-3 (AEMP 2.0) API reference - Proemion
About the Author
Editorial Team, Ortem Technologies
The Ortem Technologies editorial team brings together expertise from across our engineering, product, and strategy divisions to produce in-depth guides, comparisons, and best-practice articles for technology leaders and decision-makers.
Frequently Asked Questions
- The core fleet management KPIs are utilization rate, cost per mile or per engine hour, vehicle uptime, preventive maintenance compliance, unplanned maintenance ratio, fuel economy, idle time and accident rate. Together they show whether assets are used, maintained and run efficiently.
- Fleet utilization rate equals the hours an asset was in use divided by the hours it was available, multiplied by 100. For road vehicles you can use days or miles instead of hours. Use the same definition of available time for every asset so the numbers are comparable.
- Cost per mile equals total operating cost divided by total miles driven over the same period. Include fuel, maintenance, repairs, tyres, insurance, depreciation or lease costs, and driver wages if you want a full cost. For heavy equipment, divide by engine hours instead of miles.
- Many fleets aim for preventive maintenance compliance above 90%, meaning more than nine in ten scheduled services are completed on time. The right target depends on your assets and regulations, so track the trend and investigate any drop.
- Mean time between failures (MTBF) measures how long an asset runs between breakdowns, so higher is better. Mean time to repair (MTTR) measures how long it takes to fix an asset once it fails, so lower is better. Together they describe reliability and maintenance speed.
- A small fleet should start with five: utilization, cost per mile, uptime, preventive maintenance compliance and fuel economy. These can be calculated from a telematics feed and basic maintenance records, and they point to the biggest savings quickly.
Stay Ahead
Get engineering insights in your inbox
Practical guides on software development, AI, and cloud. No fluff — published when it's worth your time.
Ready to Start Your Project?
Let Ortem Technologies help you build innovative software solutions for your business.
You Might Also Like

Mixed-Fleet Telematics: How to Unify Data From Every Equipment Brand With ISO 15143-3 (AEMP 2.0)
Best Construction Fleet Management Software in 2026: Heavy Equipment, Mixed Fleets and Telematics