PlantOps — Enterprise Manufacturing Operations & Industrial IoT Platform
An enterprise manufacturing operations platform connecting the physical factory floor with business systems. PlantOps brings production management, machine monitoring, industrial IoT, maintenance, quality, inventory, production orders, workforce operations, analytics, alerting and AI-powered operational intelligence into one common operational layer where factory data can be monitored, investigated and acted upon.
Client
Confidential US-Based Manufacturing Organization (NDA)
Project Value
Confidential — NDA Protected
Rating
The Challenge
The client operated a complex manufacturing environment where production depended on many interconnected processes. Machines generated operational data, operators ran production, maintenance teams handled equipment issues, quality teams inspected output, warehouse teams managed materials, and plant managers needed to understand performance across all of it. The information existed, but it was fragmented: production data lived in manufacturing systems, machine data came from PLCs and industrial sensors, maintenance records sat in separate workflows, inventory was held in another system, quality inspections were documented separately, and management reporting required manual consolidation. A simple question such as "why did Line 03 miss its production target yesterday?" meant checking production output, machine downtime, maintenance events, quality holds, raw material availability, operator activity and production schedules across several teams. Management saw historical reports but not the current state of the floor, maintenance was largely reactive, production variance analysis was manual, quality failures did not always connect back to the line, machine and batch involved, material shortages could stop a line even when the data to predict them existed, and the volume of connected devices and events was growing faster than teams could interpret it.
The Goal
The objective was not another dashboard but an operational system for the factory. PlantOps had to provide one operational view across production, equipment, maintenance, quality and materials; real-time visibility of current factory conditions without manual consolidation; traceable workflows connecting every important event to its asset, production order, machine, batch or work order; proactive maintenance that uses machine and historical data to identify risks before failures interrupt production; connected quality management linking issues to product, batch, line and machine; context for plant managers rather than isolated KPIs; and AI-assisted operations that let authorized users query operational information and identify patterns in natural language.
Solution & Implementation
1Analysis
Discovery mapped production workflows, maintenance processes, quality processes, inventory, machine data sources, user roles and existing integrations before any screens were designed. The central finding was that answering real operational questions required crossing domain boundaries: a production shortfall could be explained only by combining output, downtime, quality holds, material availability and machine condition. That led to an interconnected domain model spanning assets (plants, lines, machines), production (products, orders, batches, operations), maintenance (work orders, technicians, parts, service events), quality (inspections, defects, non-conformances, corrective actions), inventory (materials, stock, locations, suppliers) and workforce (employees, roles, shifts). This shared model is what makes cross-domain analytics and AI possible, and it became the foundation for every module.
2Designing Solution
PlantOps follows a modular, event-driven enterprise architecture: an experience layer (web application, mobile workflows, operational dashboards); an application layer (production, maintenance, quality, inventory, workforce, alerts, administration); an integration layer (ERP, MES, CMMS, WMS, PLC, SCADA, IoT gateways, identity providers); a data layer (operational database, time-series data, event store, analytics data, document storage); and an intelligence layer (rules engine, machine learning, predictive models, RAG, LLM services, AI agents). Machine data flows device → gateway → ingestion → event processing → operational and time-series storage → PlantOps → analytics and AI. Operational events such as MachineStopped, InspectionFailed, WorkOrderCreated and MaterialBelowThreshold are consumed by multiple services at once, so a single failed inspection can update quality status, create a non-conformance, notify the supervisor, affect production status and recommend a maintenance action. The platform supports cloud, private cloud and hybrid deployment, because many factory systems and legacy machines must stay on-premises while enterprise applications and analytics run in the cloud.
3Customizing Business Logic
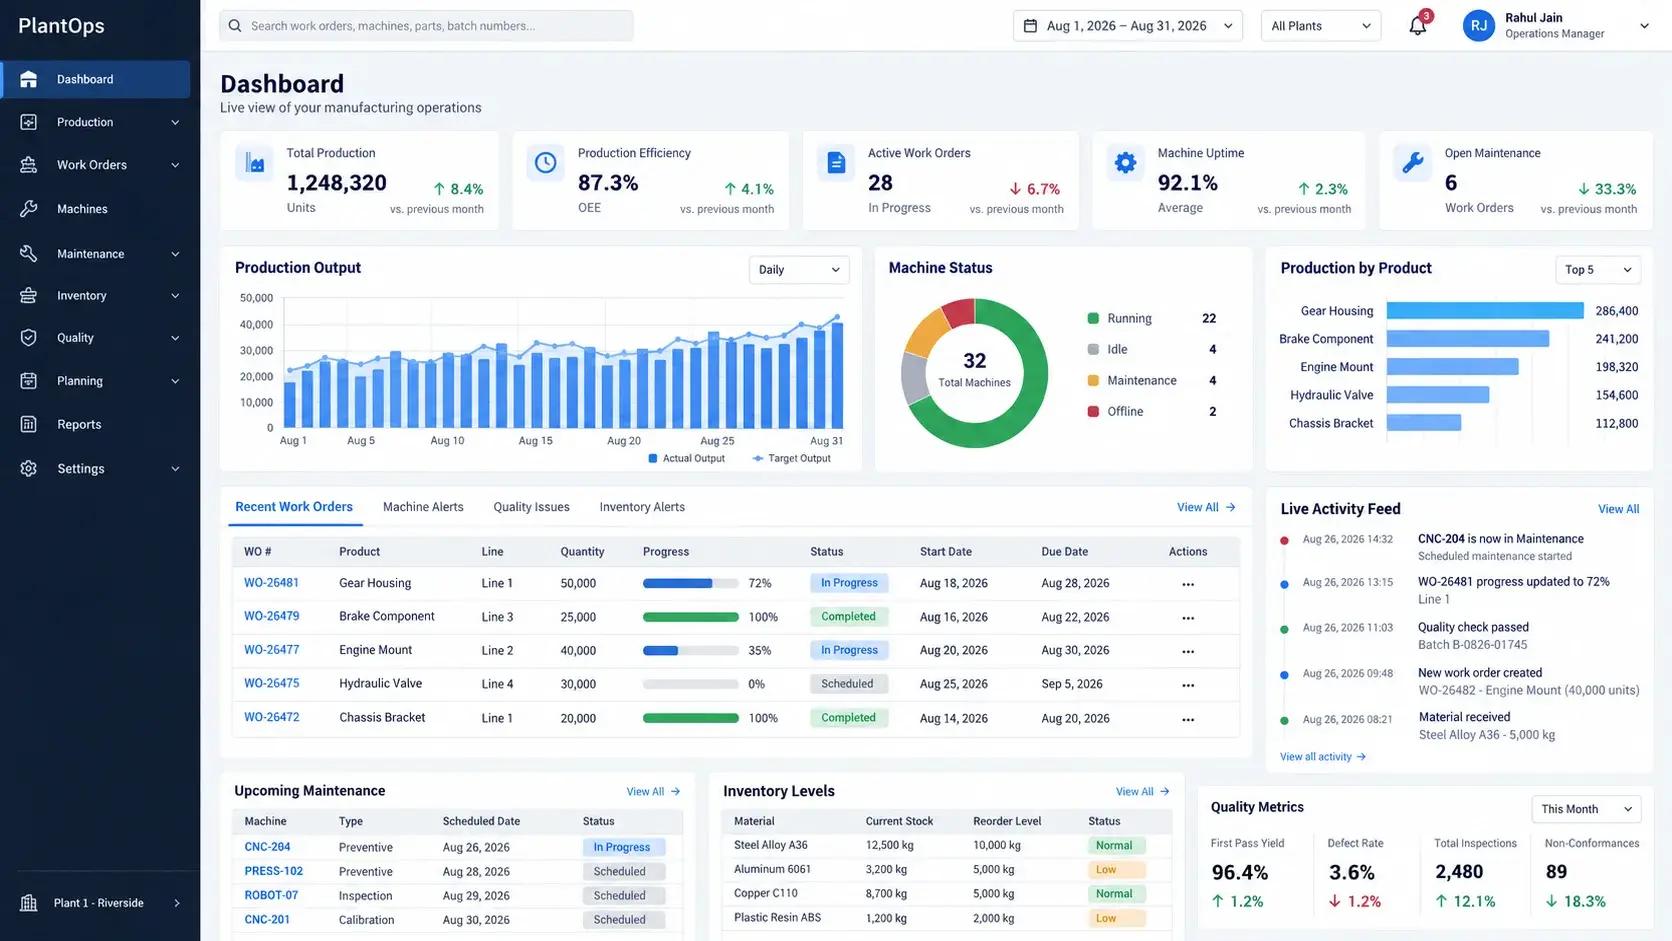
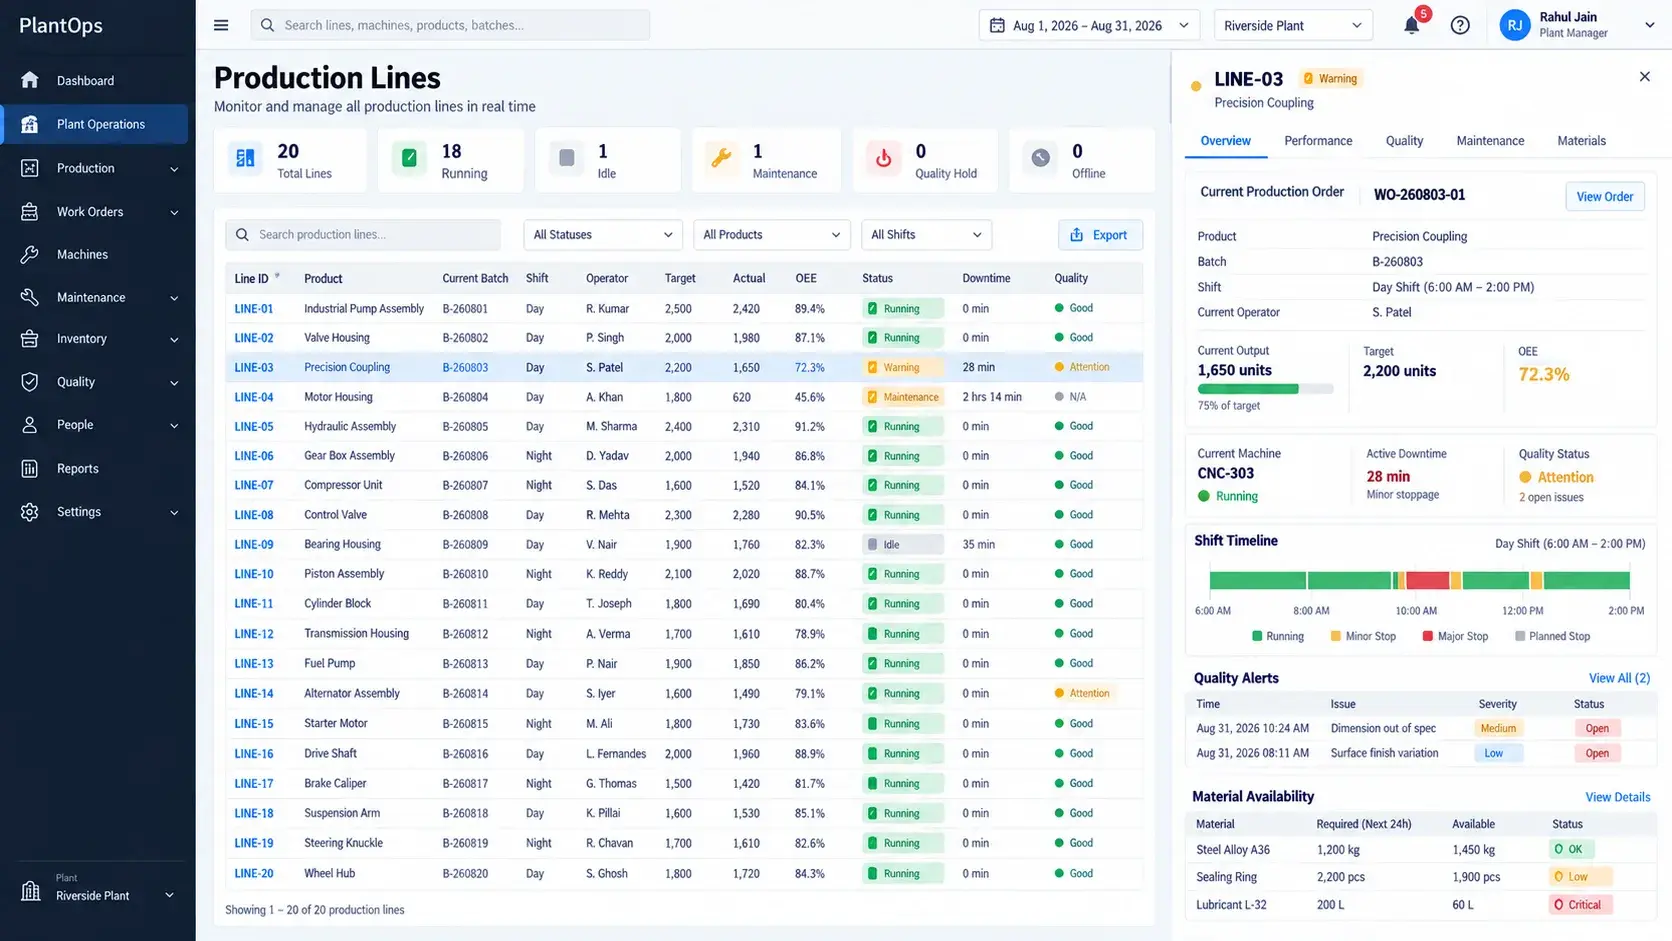
Each module works independently on the shared data model. The executive dashboard tracks output against target, OEE and its components, downtime, quality, maintenance, material shortages and alerts, filterable from plant to building, area, line, machine and shift. Production lines show status (running, idle, blocked, maintenance, quality hold, offline), batch, product, target versus actual, OEE, cycle time and operational events. Every connected machine has a digital profile with identity, live telemetry (temperature, vibration, pressure, RPM, voltage, current, power, cycle time, error codes) and history, plus a health status (healthy, needs attention, elevated risk, critical) derived from sensor trends, maintenance history, downtime and operating conditions rather than a single sensor. Downtime is categorized as planned or unplanned with reason, duration and action, building a library for analytics. Quality runs as a production process: a failed inspection creates a non-conformance tied to order, batch, machine, line, operator, shift and material lot, followed by corrective action, verification and release. Maintenance supports preventive, corrective, predictive and emergency work, with schedules based on time, runtime hours, production volume or sensor condition. Inventory covers raw materials, components, consumables and spare parts, checks production orders against available material before the line stops, and decrements stock when a work order consumes a part. Alerts are configurable by condition, recipient, channel and escalation timing, and twelve roles from platform administrator to operator carry granular view, create, edit, approve, delete, export and configure permissions with a full audit trail.
4Scale & Optimize
Because downtime in operational software can directly affect production, the platform was engineered for resilience: graceful error handling, retries, background processing, data validation, integration-failure handling, backup strategies and controlled deployment, with observability across application health, API and database performance, IoT ingestion, event processing, background jobs and AI service activity. PlantOps Intelligence was then built as a governed AI layer rather than a chatbot. A question passes through intent detection, permission validation, operational data retrieval, context assembly, analytics, rules and machine learning, and only then LLM reasoning, returning a grounded answer with its supporting evidence and recommended actions. The same layer produces predictive maintenance risk assessments, recurring-defect analysis across machine, product, shift, material and operator, and automatic daily or weekly operational summaries. The AI never acts autonomously on production: detection, risk assessment and recommendation always end in a human decision.
Results & Impact
Operational Visibility
Issue Investigation
Manual Reporting
Maintenance Coordination
Quality Traceability
Data Foundation
AI Readiness
Executive dashboard with production, OEE, downtime, quality, maintenance and material KPIs from enterprise down to machine
Production lines, production orders and work-in-progress tracked against plan in real time
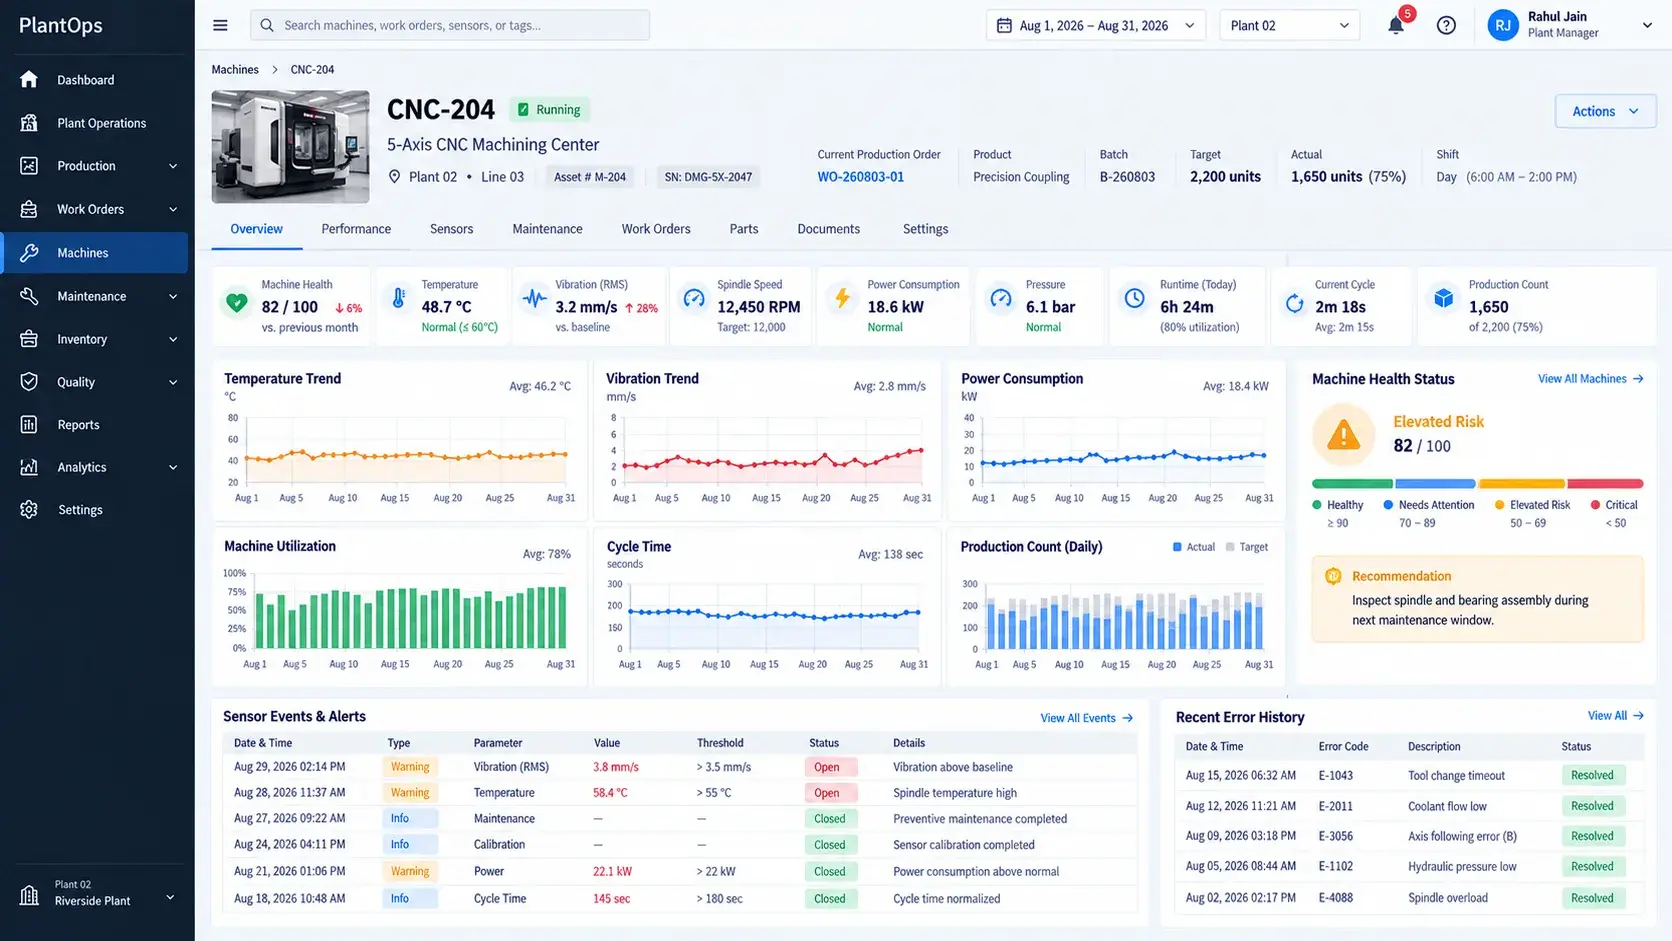
Machine monitoring with digital asset profiles, live telemetry and multi-signal machine health scoring
Planned and unplanned downtime categorized by machine, line, shift and reason
Hierarchical OEE (availability × performance × quality) at enterprise, plant, area, line and machine level
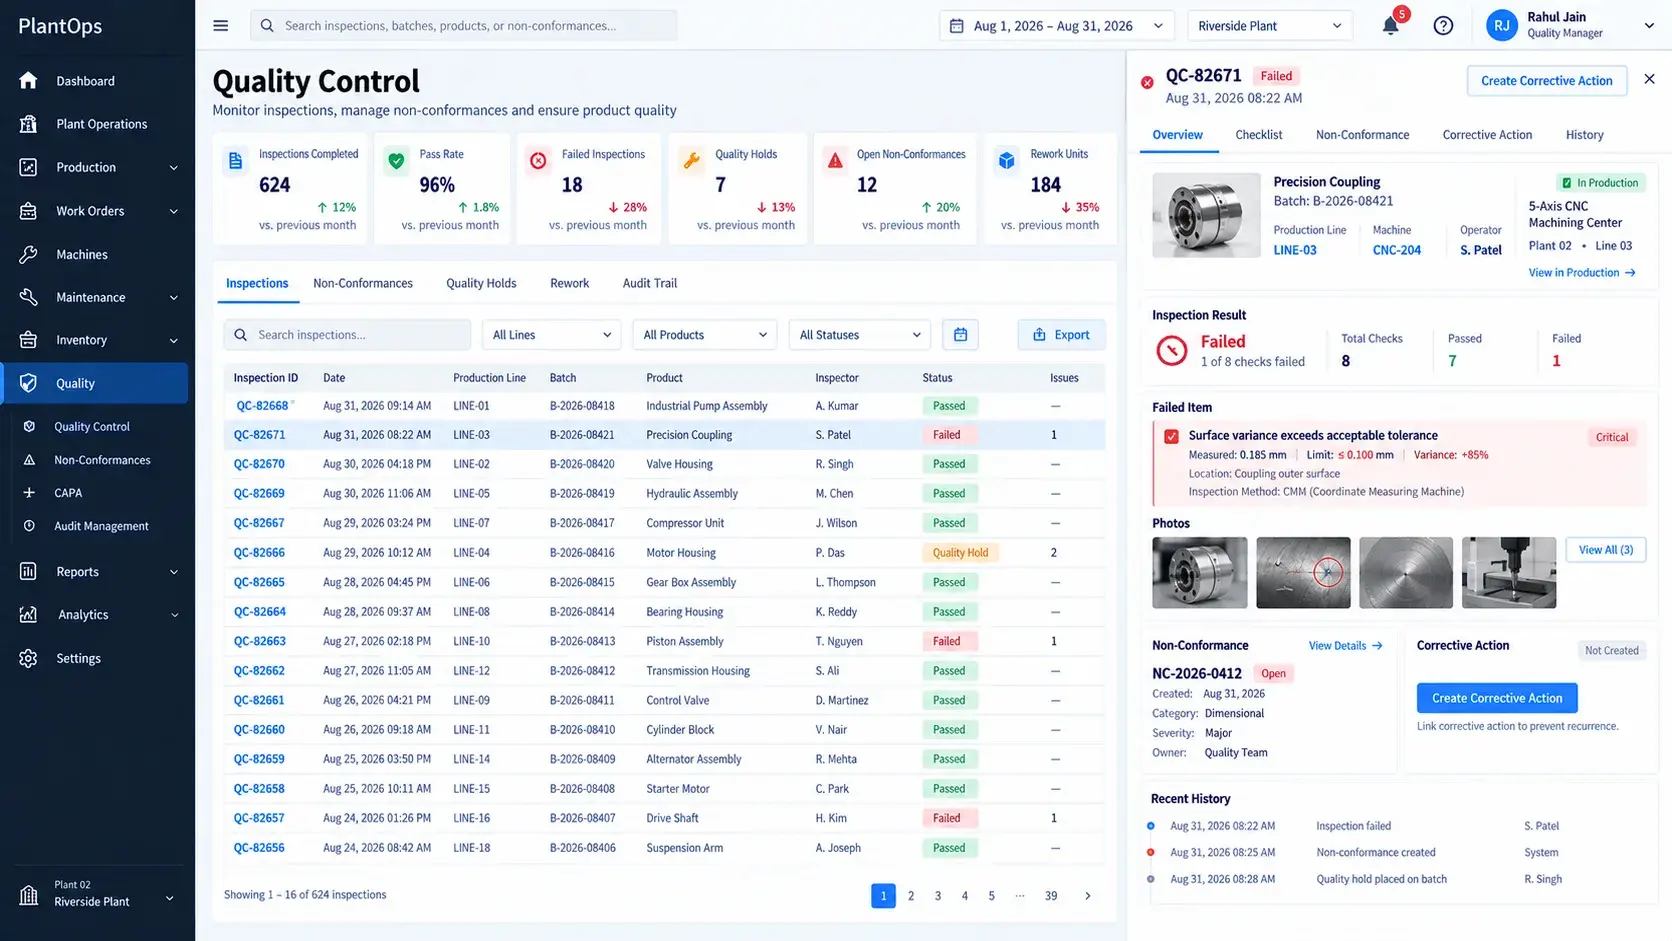
Quality inspections, non-conformances, quality holds, corrective actions and release with full traceability
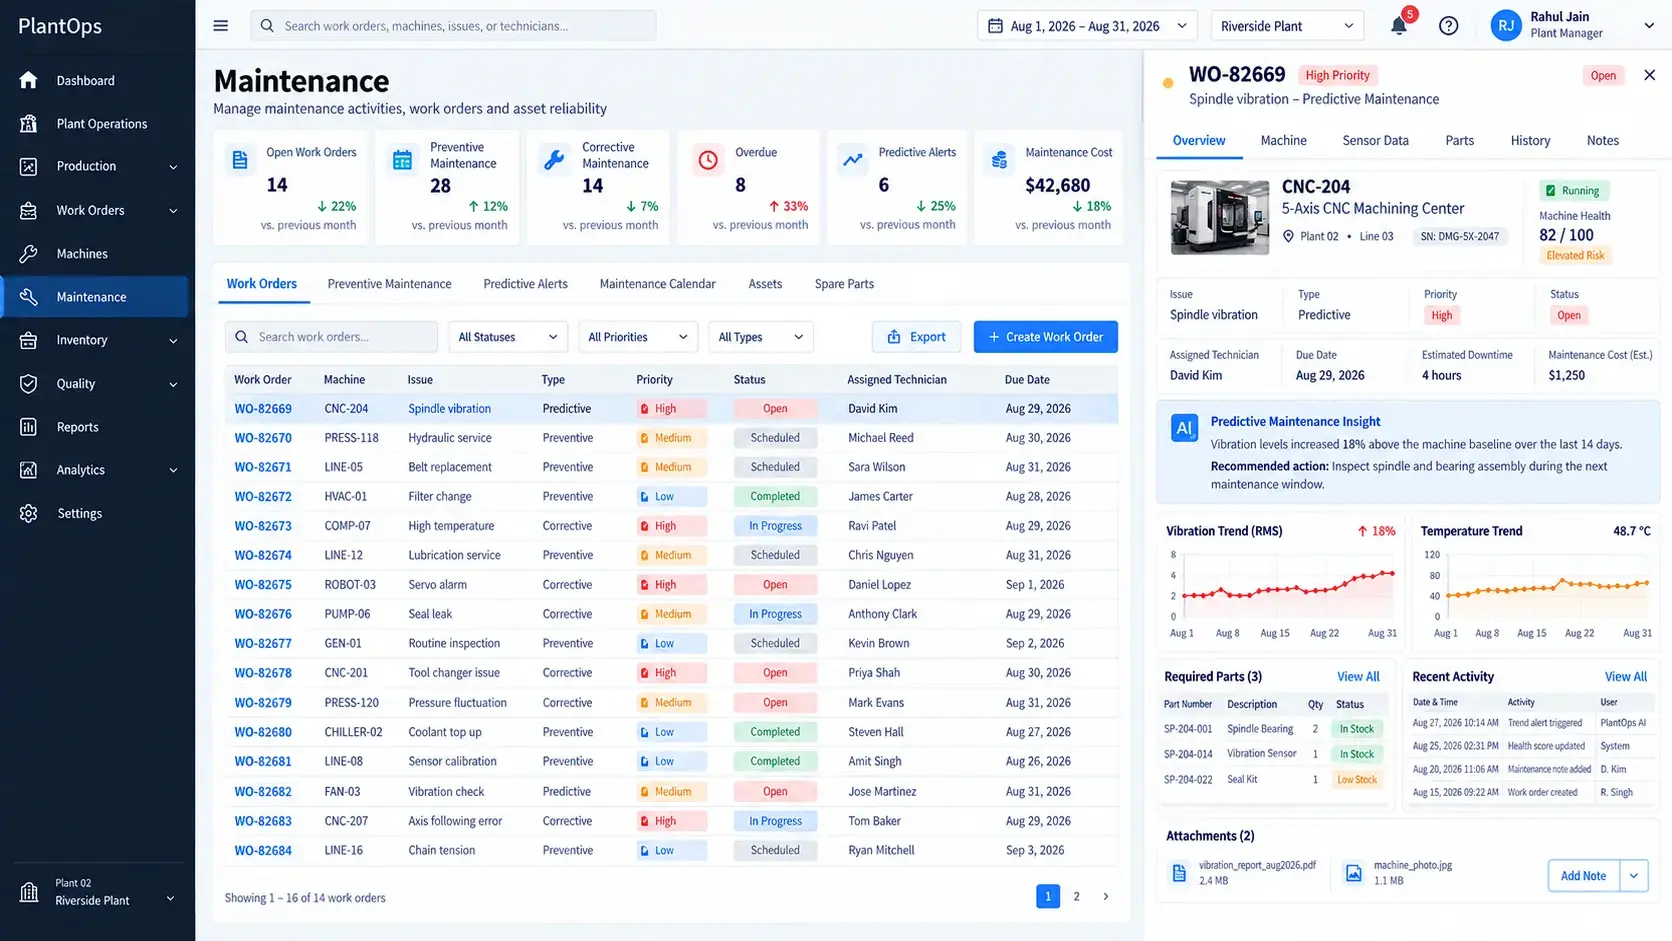
Preventive, corrective, predictive and emergency maintenance with time, runtime, volume and condition-based schedules
Industrial IoT layer ingesting PLC, sensor, gateway and energy-meter data through event processing
Inventory connected to both production orders (material availability) and maintenance work orders (parts consumption)
Configurable alerts with automatic escalation when critical events are not acknowledged
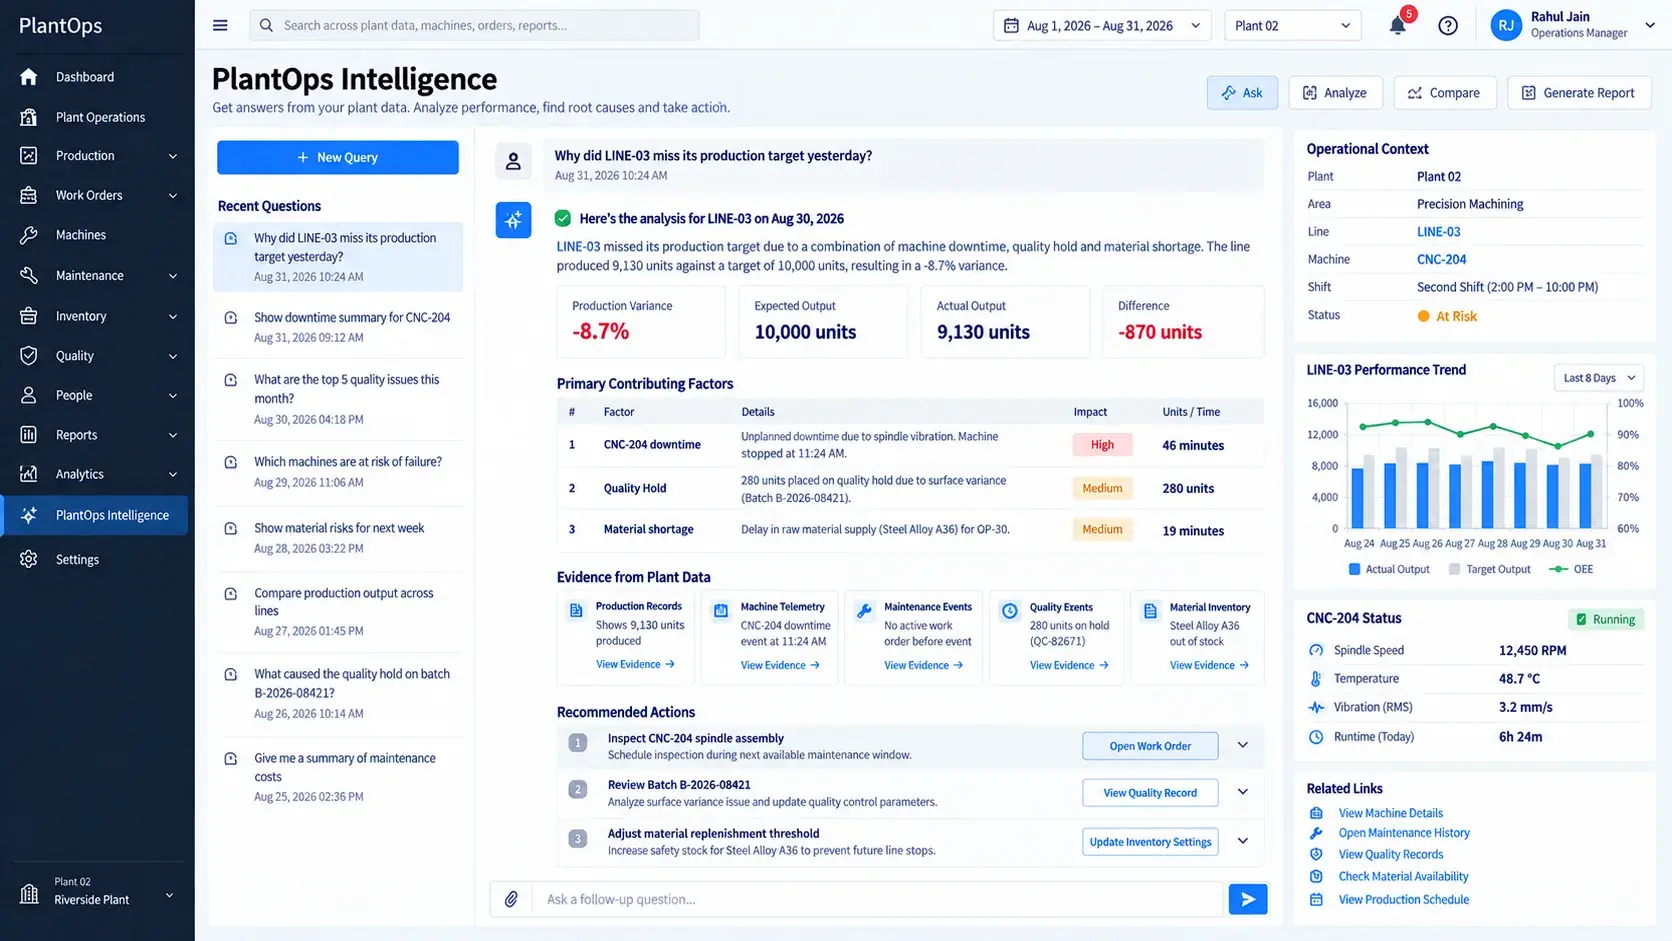
PlantOps Intelligence: grounded natural-language questions, root-cause analysis and AI operational summaries
Twelve operational roles, data segmentation by plant and department, and a complete audit trail
Key Technologies
Project Gallery
See It in Action
A 41-second walkthrough of PlantOps: the operations dashboard, production lines, machine monitoring and health scoring, quality traceability, maintenance work orders, and PlantOps Intelligence tracing a missed production target to machine downtime, a quality hold and a material delay. Illustrative platform views; client under NDA.
Technical Approach
The hardest part of PlantOps was not building individual screens. It was creating a shared operational model that connects the physical factory to the digital application. A single sensor detecting abnormal vibration has to become a machine health change, an operational alert, a production risk, a maintenance recommendation, a work order, a parts requirement, an inventory impact, a downtime record and, eventually, a management insight. One physical event influences many enterprise workflows, and PlantOps was designed around that principle.
What Makes PlantOps Different
Manufacturing software usually runs as separate systems: MES manages production, CMMS manages maintenance, QMS manages quality, ERP manages inventory, IoT platforms manage machine data, BI manages analytics, and AI sits somewhere on top. PlantOps brings these domains into one connected architecture. It does not necessarily replace existing enterprise systems; it creates the operational layer that connects them.
Architecture at a Glance
- Experience layer — web application, mobile workflows and operational dashboards
- Application layer — production, maintenance, quality, inventory, workforce, alerts and administration
- Integration layer — ERP, MES, CMMS, WMS, PLC, SCADA, IoT gateways and identity providers
- Data layer — operational database, time-series data, event store, analytics data and document storage
- Intelligence layer — rules engine, machine learning, predictive models, RAG, LLM services and AI agents
- Infrastructure — cloud, containers, monitoring, logging and CI/CD
From Machine Event to Maintenance Action
When a machine temperature crosses its threshold, an IoT event is generated, machine health is updated, an alert is created, the production manager is notified, AI analysis evaluates historical patterns, and a maintenance work order is recommended. Preventive schedules can be driven by time (every 30 or 90 days), runtime (every 1,000 or 5,000 hours), production volume (every 50,000 units) or sensor condition, so maintenance no longer depends on calendar reminders alone.
For predictive maintenance, the platform evaluates vibration, temperature, runtime, load, failure history, maintenance history, downtime patterns and production conditions. In an illustrative example, CNC-204 shows vibration 18% above its historical baseline, temperature 7% above normal, three recent downtime events and a bearing replacement 74 days earlier. PlantOps Intelligence rates the risk as elevated and recommends inspecting the spindle and bearing assembly in the next maintenance window. The recommendation remains subject to human review: detection, risk assessment and recommendation always end in a human decision.
PlantOps Intelligence: Grounded AI, Not a Chatbot
PlantOps Intelligence does not simply pass a question to an LLM. Every query follows a controlled pipeline:
- User question
- Intent detection
- Permission validation
- Operational data retrieval
- Context assembly
- Analytics, rules and machine learning
- LLM reasoning
- Grounded response with source evidence
- Recommended action
In an illustrative investigation, a plant manager asks why Line 03 missed its production target. PlantOps returns output of 9,130 units against a 10,000-unit target (8.7% below plan), identifies the contributing events — 46 minutes of unplanned CNC-204 downtime from spindle vibration, a 280-unit quality hold on batch B-2026-08421 and a 19-minute material shortage — links each finding to the production records, machine telemetry, maintenance events, quality events and material inventory behind it, and recommends inspecting the spindle assembly, reviewing the quality hold and raising the material replenishment threshold. The user gets both the explanation and the next action. The same layer analyzes recurring defects across machine, product, shift, material and operator, and prepares automatic daily or weekly operational summaries.
Traceable Quality Workflow
Production triggers an inspection. A pass lets production continue; a failure creates a non-conformance, identifies the production order, batch and machine, places a quality hold, and routes the batch through corrective action, verification and release. Every step is auditable, and because each failure is linked to line, machine, operator, shift and material lot, the quality team can investigate patterns such as repeated surface defects on one line after a particular material batch.
Security, Governance and Audit
Twelve operational roles — platform administrator, plant administrator, plant manager, operations manager, production supervisor, maintenance manager, maintenance technician, quality manager, quality inspector, inventory manager, operator and executive read-only — carry granular permissions to view, create, edit, approve, delete, export, configure and administer. Data can be segmented by organization, plant, department, production area, role and user, so a technician sees machine and maintenance information while an executive sees aggregated performance across facilities. Important changes record the user, timestamp, action, previous value, new value and affected entity.
Integrations and Deployment
PlantOps was designed integration-first, with controlled APIs for machines, production, work orders, inventory, quality, users, notifications and analytics. It connects to ERP (material planning, purchasing, costs), MES (scheduling and production events), PLC and SCADA (telemetry, process data, alarms), CMMS, WMS, HR and workforce systems, identity providers for single sign-on, and BI platforms. The same API layer serves the web application, mobile workflows for technicians, inspectors and operators, external integrations and AI services without duplicating business logic. Deployment can be cloud, private cloud or hybrid, which matters in industrial environments where legacy machines cannot simply move to public cloud infrastructure. The implementation stack can vary with the existing technology environment and integration requirements of each client.
How the Engagement Was Delivered
- Discovery — production, maintenance, quality and inventory workflows, machine data, user roles and existing integrations
- Architecture — domain model, APIs, IoT data flows, event architecture, security model, cloud infrastructure and integration strategy
- Product design — plant dashboards, production workflows, machine screens, maintenance, quality, inventory, analytics and mobile experiences
- Engineering — core platform, web application, APIs, IoT ingestion, data services, workflow automation and integrations
- Intelligence — predictive analytics, anomaly detection, natural-language queries, AI summaries and recommendations
- Deployment and optimization — production deployment, monitoring, performance tuning, user feedback and workflow refinement
What Changed
Before: machine data → PLC / SCADA → production system → spreadsheet → maintenance system → quality system → manual management report.
After: machine → IoT and event layer → PlantOps (production, maintenance, quality, inventory, analytics and AI) → operational decision.
The transformation was organizational as much as technological: the same data became usable across every team, and an investigation that once crossed several systems now happens in one environment — from a Line 03 alert at the start of a shift, to the contributing events, to the machine record, to an assigned maintenance work order.
About the Engagement
The client name, proprietary production information, internal architecture, operational datasets and commercial details are protected under NDA. This case study therefore focuses on the product, its workflows, its architecture and the engineering challenges, without disclosing confidential client information. Images, names and figures shown on this page are illustrative representations of the platform and do not show client data.
Related: manufacturing software development, industrial IoT development, AI and machine learning, data engineering and the OpsCommand enterprise fleet operations case study.
Frequently Asked Questions
About Ortem Technologies
Ortem Technologies is a premier custom software, mobile app, and AI development company. We serve enterprise and startup clients across the USA, UK, Australia, Canada, and the Middle East. Our cross-industry expertise spans fintech, healthcare, and logistics, enabling us to deliver scalable, secure, and innovative digital solutions worldwide.
Related Case Studies
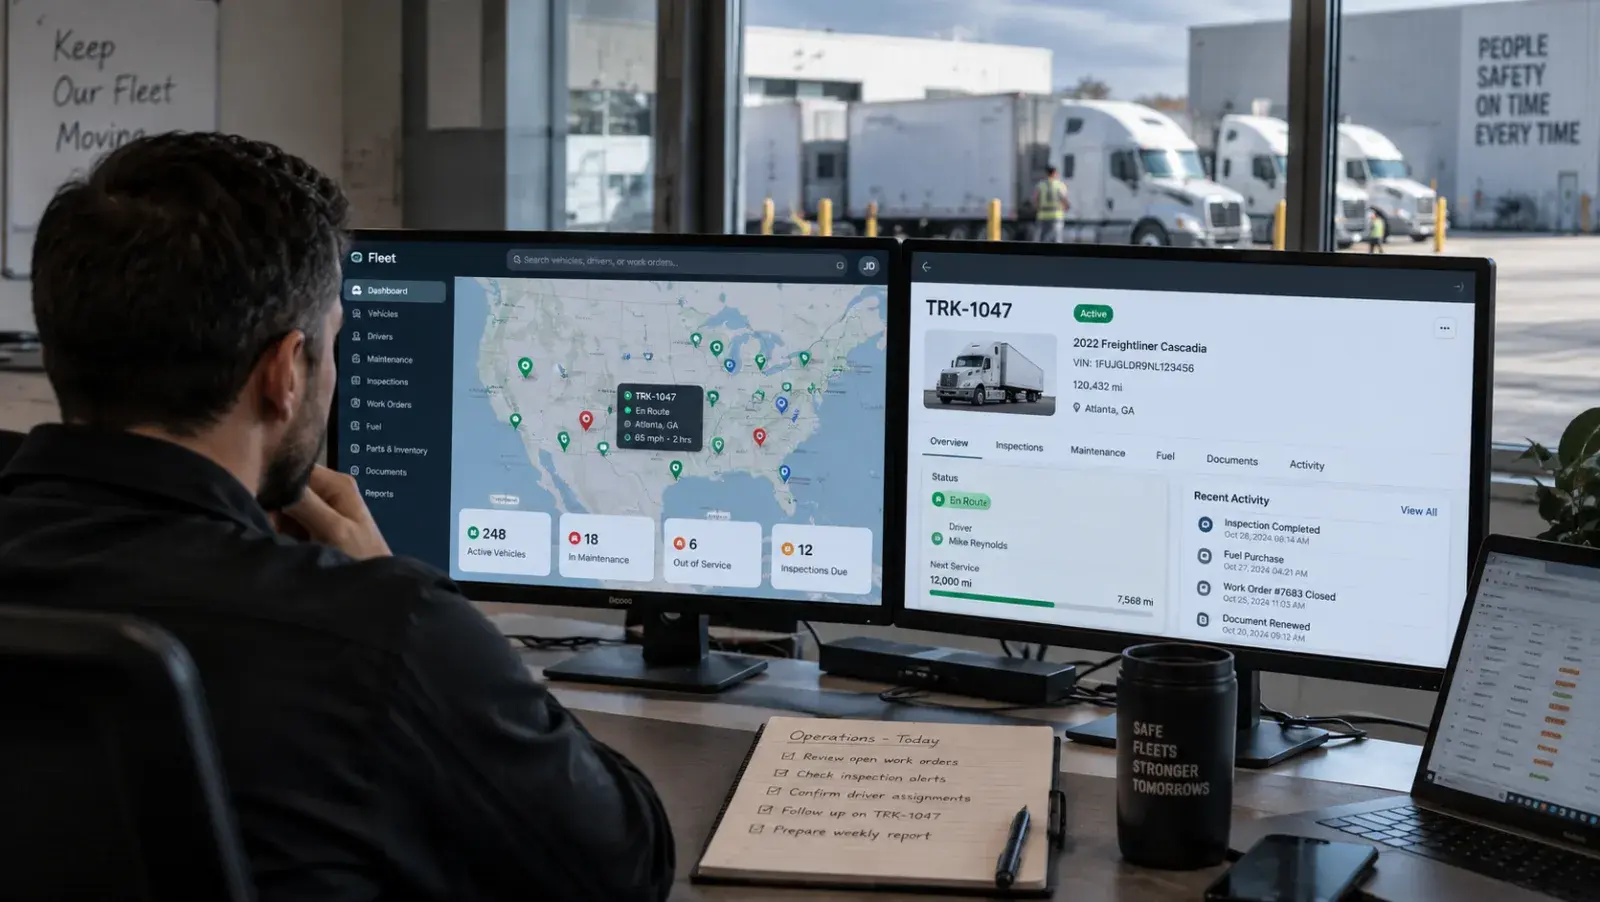
Multinational Transportation & Field Services Organization (NDA)
OpsCommand — Enterprise Fleet, Logistics & Intelligent Operations Platform
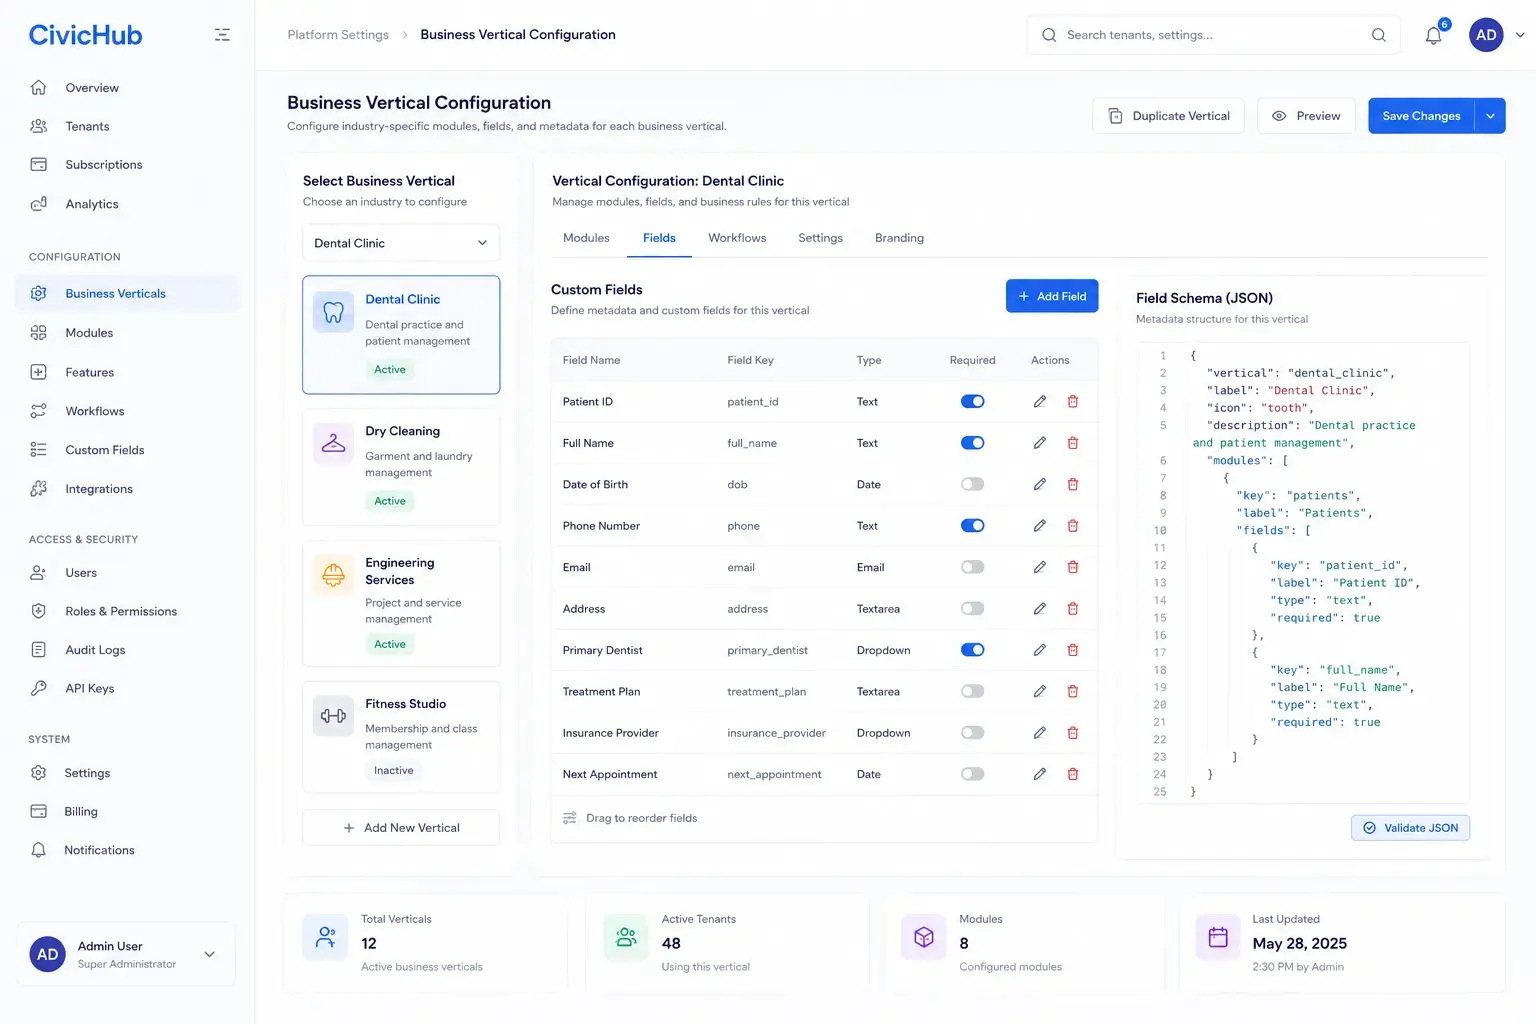
Regional Nonprofit Consortium (NDA)
CivicHub — Unified Identity & Multi-Tenant Platform for a Regional Nonprofit Consortium
Ready to Build Something Like This?
We've built manufacturing & industrial iot solutions like this for teams across the US, UK, and Middle East. Fixed scope. Fixed price. Senior engineers from day one.
Free 30-minute scoping call — no commitment, no sales pitch.